
The Blueprint CLI can open a live browser view of the project without starting the application or changing any files.
Open the dashboard
With the optional global CLI installed, run this from a Blueprint project or any nested directory:
blueprint dashboardWithout the global CLI, run the same dashboard through npx:
npx create-ai-blueprint@latest dashboardThe command opens the dashboard in your browser and keeps the terminal process
running. Press Ctrl+C when you are finished.
Interactive installs and
updates offer the matching global CLI for the
shorter command, but it is not required. The older ui command remains as a
deprecated alias.
Use --target when you are outside the project:
blueprint dashboard --target /path/to/projectUse --no-open when you want the local URL without opening a browser
automatically:
blueprint dashboard --no-openWhat it shows
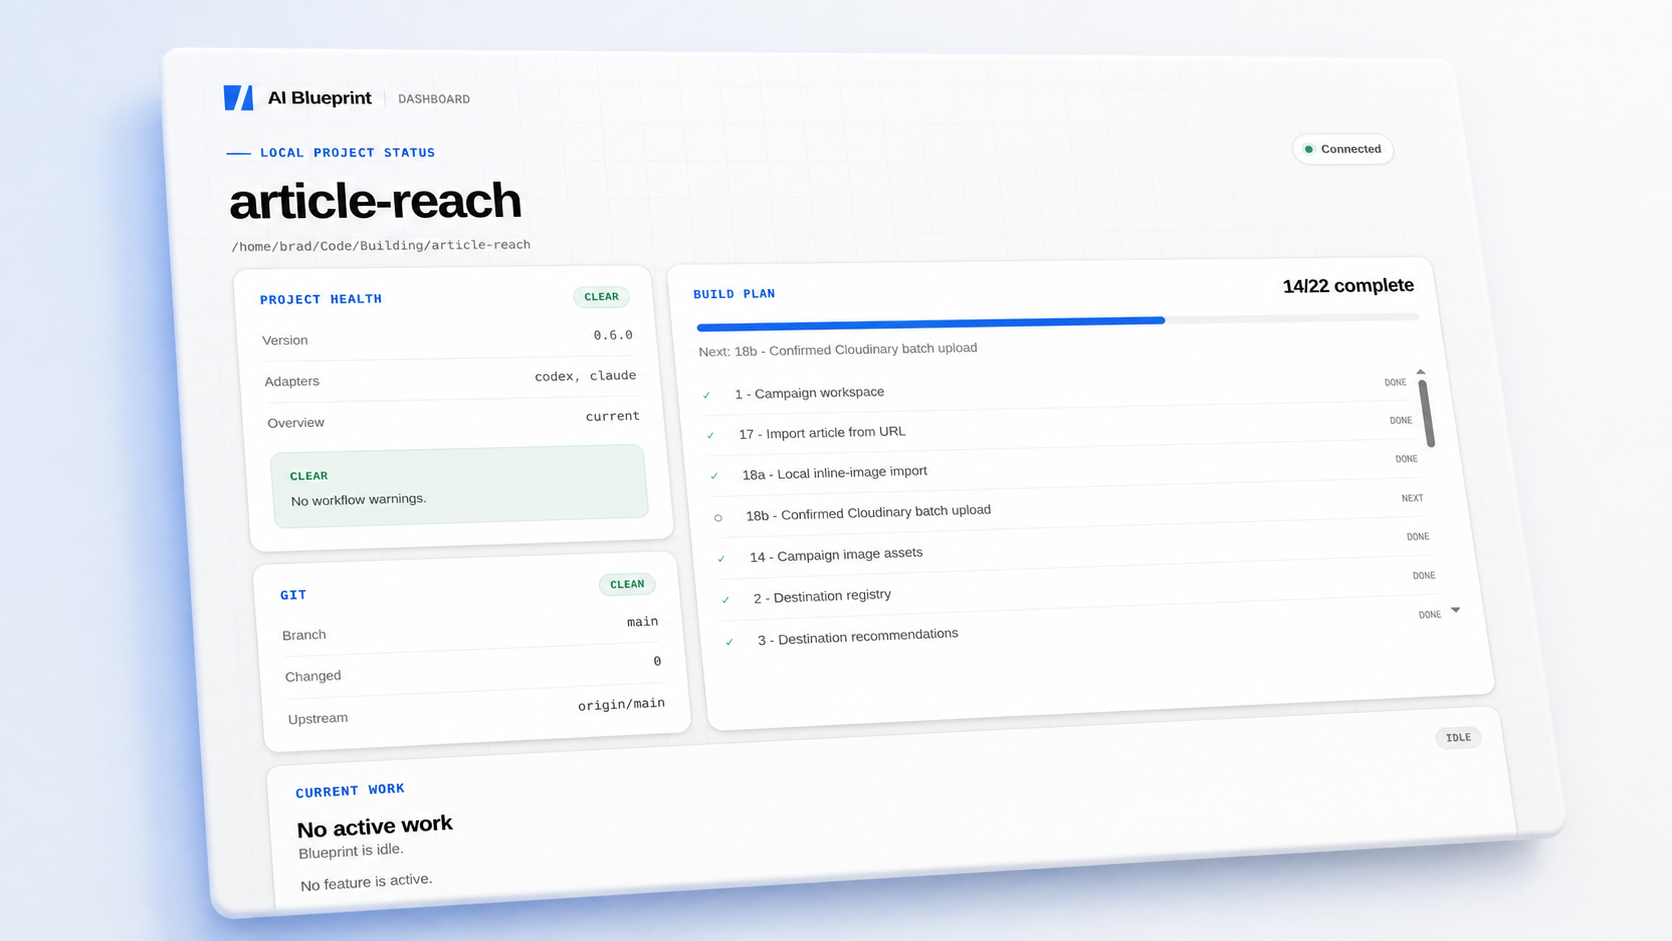
The dashboard refreshes immediately when Blueprint files or Git state change, with a slower fallback refresh if a file event is missed. It shows:
- Project configuration state, review execution, and regular and Continuous quality-gate modes
- The complete build-plan roadmap with done, current, next, and planned work
- The active feature, fix, or rollback and its build-step checklist
- Completed features, fixes, and rollbacks from Blueprint history
- Active findings and completion blockers
- The active or most recent substantial Blueprint command
- The current branch, changed-file count, and upstream state
- One deterministic next command and the reason for it
If Git status inspection fails, including when its output exceeds the command buffer, the Git panel reports unavailable while the rest of the dashboard continues to refresh.
On initial load, the roadmap centers the active unchecked feature, or the next unfinished feature when no work is active. Completing a feature moves the focus to the new target. Ordinary refreshes preserve your manual scroll position.
Active findings appear in a sortable table with F#, P#, Status, and Description columns. The default order is priority, lifecycle status, then finding number. Selecting another column makes it the highest-priority sort while preserving the previous columns as tie-breakers. Selecting the primary column reverses it.
An older activity record remains visible as interrupted. It does not count as a project-health issue when the record itself is valid. The Resume line appears only when its saved command matches the current recommended action, so old activity cannot offer a conflicting shortcut.
Theme
The dashboard follows your operating system theme on first use. A sun or moon button beside the Connected status switches between light and dark mode.
Your explicit choice is saved in the browser for one year and shared by every
Blueprint dashboard opened on 127.0.0.1, including dashboards for other
projects and dashboards that use a different available port. The preference is
renewed when you load a dashboard. It does not write to the project or its
Blueprint state.
The completion gate reports Idle when no feature, fix, or rollback is active.
For active work, failed verification, unfinished steps, blocking findings,
review requirements, malformed evidence, invalid configuration, unavailable Git,
or a branch mismatch block completion. Missing or incomplete verification needs
checking even when all steps are checked. Failed verification routes to
Implement; malformed review/findings records or unsafe findings paths route to
Doctor. The dashboard reads recorded evidence and does not run verification.
Checking off a completed build-plan item updates roadmap progress without making the overview stale. Status ignores only checkbox completion markers in the plan fingerprint. Changes to feature wording, order, scope, or other plan content still route the next action through Overview.
Local-only boundary
The dashboard binds to 127.0.0.1 on an available port. It is available only
on the local machine while the CLI process is running. It does not start the
project’s development server, execute workflow commands, edit files, store
project state, send telemetry, or make external requests. The optional theme
preference stays in the local browser.
The browser listens for local file-change events while the tab is visible and keeps a slower polling fallback. Each response is rebuilt from the current Blueprint files and Git state, so running commands, checked steps, findings, branch changes, and archived work appear without restarting the dashboard.
Tracked skills write their generated activity record through a packaged helper, not by constructing JSON directly. The helper validates every field and uses an atomic replacement, so invalid input leaves the previous dashboard state intact. Malformed legacy activity points to Doctor for an approved reset.
See CLI Status for the terminal report built from the same project state.